


A Month Of
Two Markets
The Nifty 500 did not move in August. Underneath it, microcaps rose 5.4% and the Nifty 50 fell 1.2%. July’s rotation into large caps lasted exactly one month.
The Nifty 500 was flat. Microcaps hit a 2026 high.
The Nifty 500 closed August at 23,450.4, down 0.04% on the month and 2.7% below its January peak. The flat headline hides the widest size spread of the year: 6.6 points between microcaps and the Nifty 50.
| Segmentlarge to small | Aug (1M) | Rolling 3M | Rolling 6M |
|---|---|---|---|
| Nifty 50 (large) | −1.2% | +2.3% | −4.4% |
| Nifty 100 | −1.0% | +2.5% | −2.6% |
| Nifty 500 | −0.0% | +3.5% | +1.2% |
| Midcap 150 | +1.7% | +4.3% | +7.7% |
| Smallcap 250 | +2.5% | +8.1% | +15.7% |
| Microcap 250 | +5.4% | +12.3% | +24.6% |
Read the first column from the bottom up. The smaller the segment, the better the month, and the order is unbroken. Last month this table ran the other way. The Microcap 250 closed August at its highest level of 2026, while the broad index is still below where it started the year.
The Nifty 500 was flat, so beating it meant little more than finishing the month positive: 87% of 270 diversified funds did, and 39 lost money. The gap between categories is the real signal. Every Mid Cap, Small Cap and Multi Cap fund beat the index. Only 57% of Large Cap funds did, on a median return of 0.0%. In July the same table read 80% for large caps and 19% for small caps.
The sector picture was quiet. The best theme, manufacturing, returned 3.8% and the worst, energy, lost 0.6%. In July that spread ran from 11.9% to −0.9%. August was about size, not sector.
One caution before the tables. These figures are as on 31/08/2026. The market has fallen since. The Nifty 500 closed at 22,654.7 on 17/09/2026, 3.4% below the August close, and the Midcap 150 is down 4.1%. Small and micro caps have fallen least. August was a good month for most funds in this issue. September so far has not been.
July’s rotation lasted exactly one month.
Last month large caps led, technology led, and this publication asked whether the rotation would hold. It did not. In August the money went straight back down the size ladder, and the funds that won July gave most of it back. The universe: 270 diversified direct growth funds across nine categories.
The share of funds beating the index, by category, this month against the rolling quarter:
| Category | Beat N500 in August▼ | Beat N500, rolling 3M |
|---|---|---|
| Mid Cap | 100% | 94% |
| Small Cap | 100% | 100% |
| Multi Cap | 100% | 97% |
| Focused | 93% | 86% |
| Large & Mid | 91% | 83% |
| Flexi Cap | 84% | 89% |
| Contra | 75% | 50% |
| Value | 65% | 61% |
| Large Cap | 57% | 80% |
The ▼ marker in a table header shows which column that table is ranked on. Rankings use the rolling three month return throughout; one month figures are context only.
Read the ranking rather than the level. Large caps sit at the bottom of both columns. Everything below them in size sits at the top.
The cleanest test is what happened to the nine funds named in the July issue:
| Fund | Role in the July issue | August▼ |
|---|---|---|
| Motilal Oswal Multi Cap | Featured fund | +7.6% |
| Union Small Cap | June feature, follow-up | +6.3% |
| JM Small Cap | Rally leader | +4.5% |
| Invesco India Flexi Cap | Rally leader | +2.4% |
| Samco Flexi Cap | Slider (cash whipsaw) | +2.2% |
| Samco Large & Mid | Slider (cash whipsaw) | +1.7% |
| Samco Large Cap | Slider (cash whipsaw) | +0.4% |
| Quant Focused | Rally leader | +0.4% |
| Parag Parikh Flexi Cap | Rescued by July’s rotation | −1.4% |
The order has inverted almost exactly. Parag Parikh Flexi Cap, which July’s rotation rescued, is the only one of the nine to lose money in August. The three Samco funds, which lost money in a rising July, all made money in a flat August. Quant Focused went from rally leader to nearly nothing.
The whip was systematic, not anecdotal. Four HSBC funds moved from the bottom decile of the universe in July to the top decile in August. Four Motilal Oswal funds beat in both months, which almost nothing else did. One fund house was positioned for the reversal and another for the reversal of the reversal.
Two months, two opposite answers. The rolling three and six month columns still belong to small caps, and now the one month column does too. That makes August a resumption rather than a new question.
Four Quant funds fell from top to bottom.
Each fund’s percentile within its category on the rolling three month window, last issue against this one. The fallers are not a scattered group. Four of the five come from the same house.
| Moved upby size of move | Category | Last issue percentile | Current percentile |
|---|---|---|---|
| Motilal Oswal Large & Midcap | Large & Mid | 9 | 94 |
| Tata Value | Value | 33 | 76 |
| SBI Small Cap | Small Cap | 9 | 51 |
| Capitalmind Flexi Cap | Flexi Cap | 7 | 48 |
| HSBC Focused | Focused | 48 | 89 |
| Moved downby size of move | Category | Last issue percentile | Current percentile |
|---|---|---|---|
| Quant Large Cap | Large Cap | 97 | 3 |
| Quant Large & Mid Cap | Large & Mid | 94 | 3 |
| Quant Focused | Focused | 89 | 7 |
| Quant Value | Value | 76 | 5 |
| Quantum Small Cap | Small Cap | 74 | 6 |
Quant and Quantum are different fund houses despite the similar names. Four of these five funds are Quant; Quantum Small Cap is not one of them.
A percentile rank of 94 means the fund beat 94% of its own category on that window. The first column is the rank on the May to July window, which is what last issue showed. The second is the rank on the June to August window. Large moves mean the newest month changed the story, not that the fund changed.
Motilal Oswal Large & Midcap is the mirror image. It was the biggest faller in last month’s table, dropping from 94 to 9. It is the biggest riser in this one. Nothing about the fund changed in thirty days. The market changed direction twice.
A newly launched fund leads the small caps.
Tables rank on the rolling three month return, June to August. The bracketed number is where the fund stood in last issue’s table on the May to July window.
| Multicap mandate (Flexi, Multi, Large & Mid) | 3M▼ | Rank last issue | 1M | 1Y |
|---|---|---|---|---|
| Motilal Oswal Multi Cap | +19.2% | 1 | +7.6% | +13.1% |
| Motilal Oswal Flexi Cap | +14.4% | 5 | +5.9% | +7.4% |
| LIC MF Flexi Cap | +13.2% | 4 | +4.6% | +14.4% |
| ICICI Pru Flexi Cap | +12.9% | 11 | +3.0% | +14.2% |
| UTI Flexi Cap | +12.7% | 2 | +1.6% | +3.7% |
| Large Cap | 3M▼ | Rank last issue | 1M | 1Y |
|---|---|---|---|---|
| Taurus Large Cap | +10.9% | 4 | +1.9% | +10.9% |
| Invesco India Largecap | +8.9% | 1 | +1.9% | +10.2% |
| Axis Large Cap | +7.3% | 3 | +0.2% | +3.2% |
| HSBC Large Cap | +6.6% | 13 | +0.9% | +5.0% |
| Franklin India Large Cap | +6.3% | 7 | +0.5% | +2.9% |
| Mid Cap | 3M▼ | Rank last issue | 1M | 1Y |
|---|---|---|---|---|
| Motilal Oswal Midcap | +16.1% | 3 | +6.6% | +5.6% |
| TRUSTMF Mid Cap | +12.1% | 1 | +5.3% | n/a |
| Taurus Mid Cap | +11.2% | 5 | +2.7% | +9.4% |
| Invesco India Midcap | +10.9% | 2 | +2.5% | +16.1% |
| Bandhan Mid Cap | +10.1% | 9 | +5.2% | +16.3% |
| Small Cap | 3M▼ | Rank last issue | 1M | 1Y |
|---|---|---|---|---|
| Groww Small Cap | +17.6% | 9 | +7.4% | n/a |
| Motilal Oswal Small Cap | +15.6% | 2 | +4.3% | +28.5% |
| ITI Small Cap | +15.0% | 7 | +5.7% | +26.4% |
| Bank of India Small Cap | +14.6% | 3 | +6.0% | +32.1% |
| Mahindra Manulife Small Cap | +14.5% | 13 | +6.1% | +24.0% |
TRUSTMF Mid Cap and Groww Small Cap launched in 2026 and have no one year record yet.
| Non-diversified top 10 (sector, thematic, overseas) | 3M▼ | 1M | 1Y |
|---|---|---|---|
| Aditya Birla SL Transportation and Logistics | +20.8% | +6.0% | +26.8% |
| Motilal Oswal Consumption | +20.5% | +4.8% | n/a |
| SBI Innovative Opportunities | +20.2% | +6.8% | +14.6% |
| HDFC Transportation and Logistics | +19.8% | +5.2% | +19.6% |
| SBI Automotive Opportunities | +19.0% | +7.0% | +38.3% |
| Bajaj Finserv Healthcare | +17.7% | +5.6% | +27.1% |
| PGIM India Healthcare | +17.4% | +3.7% | +29.3% |
| Axis Innovation | +15.8% | +7.7% | +19.9% |
| Motilal Oswal Business Cycle | +15.7% | +4.3% | +3.1% |
| ICICI Pru Transportation and Logistics | +15.7% | +2.8% | +19.0% |
Three transportation and logistics funds and one automotive fund sit in this table. Auto and transport was the best theme of the quarter at 15.7%. No overseas fund appears at all this month.
Best single month among diversified funds: Samco Small Cap, +7.7%. Worst: NJ Value, −2.0%. Thirty-nine of 270 funds lost money.
These tables are a record of what happened, not a list of what to buy.
Funds sold IT and bought LIC.
Sector weights barely moved. Nothing shifted by more than a third of a percentage point, against 0.6 points last month. The action was in single names, not sectors.
| Sector | Jul | Aug | Shift▼ |
|---|---|---|---|
| Auto Components | 4.62% | 4.93% | +0.31 |
| Financial Technology | 1.08% | 1.36% | +0.28 |
| Insurance | 2.08% | 2.33% | +0.25 |
| Finance / NBFC | 5.90% | 5.65% | −0.25 |
| Banks | 17.78% | 17.47% | −0.31 |
| Power | 2.77% | 2.45% | −0.32 |
Last month this section reported that IT weights rose while funds barely bought the sector. August answers the question. Funds sold IT hard: a net ₹3,389 crore out of the sector, with 15 names cut against 9 added. The IT weight fell from 5.07% to 4.92%. Managers used the rally to leave.
The single largest trade of the month, by a wide margin:
| Biggest additions to existing positions | Bought▼ |
|---|---|
| Life Insurance Corporation of IndiaHeld by 12 funds in July, 47 in August | +₹10,347 Cr |
| Aster DM Quality Care | +₹2,472 Cr |
| TD Power Systems | +₹2,389 Cr |
| Manipal Health EnterprisesBought pre-listing in July, added after listing | +₹2,146 Cr |
| One97 Communications | +₹2,118 Cr |
| Biggest trims | Sold▼ |
|---|---|
| ICICI Bank | −₹3,579 Cr |
| Eternal | −₹2,211 Cr |
| Reliance Industries | −₹1,411 Cr |
| Infosys | −₹1,350 Cr |
| Power Finance Corporation | −₹1,087 Cr |
Diversified direct growth funds, month-end disclosures. Trade value approximated as the change in shares held, valued at the end-August price.
The LIC position went from ₹1,829 crore to ₹12,147 crore, and from 12 funds to 47. The share price barely moved across the month, so this is buying rather than a price effect. It was funded by selling, not by cash: average cash rose from 2.19% to 2.57%, and the five largest trims above come to roughly ₹9,600 crore. The government sold part of its stake in LIC through an offer for sale in early August, which is the likely source of the shares. That last point comes from outside this data.
Two funds account for more than half the position. ICICI Pru Value Fund holds ₹3,536 crore, which is 5.89% of the fund, and ICICI Pru Multi Asset holds ₹3,349 crore. LIC now makes up 0.42% of the diversified equity book, against 0.06% in July.
State owned companies were otherwise sold. Power Finance lost a quarter of its shares and went from 44 funds to 34. Indian Oil fell 21%, GAIL and ONGC 9% each, NTPC and Bharat Petroleum 5%. LIC was the exception, not the pattern.
Funds took the big listings and skipped the small ones.
Funds opened positions in 24 companies absent from the July book, worth ₹5,511 crore. As in July, almost all of them are new listings. What changed is how unevenly the money was spread.
| Company | Position▼ | Funds | To 31 Aug | Since 31 Aug |
|---|---|---|---|---|
| Dhoot TransmissionListed 17/08 | ₹2,162 Cr | 33 | +24.2%* | +7.1% |
| ShiprocketListed 19/08 | ₹572 Cr | 21 | −3.2%* | −13.0% |
| Milky Mist Dairy FoodListed 18/08 | ₹559 Cr | 14 | +16.2%* | +30.3% |
| Lalithaa Jewellery MartListed 24/08 | ₹347 Cr | 7 | +3.8%* | +12.6% |
| Leap IndiaListed 14/08 | ₹259 Cr | 13 | +15.8%* | −18.8% |
| Horizon Industrial ParksListed 24/08 | ₹254 Cr | 12 | −2.2%* | −8.3% |
| Symbiotec PharmalabListed 01/09, after the book date | ₹211 Cr | 24 | n/a | −4.7%† |
| Molbio DiagnosticsListed 17/08 | ₹209 Cr | 7 | +4.3%* | +18.3% |
| Gaja Alternative Asset ManagementListed 26/08 | ₹160 Cr | 10 | −10.5%* | −4.0% |
| Augmont EnterprisesListed 31/08, the last trading day | ₹158 Cr | 4 | n/a | −10.7% |
| Tempsens InstrumentsListed 28/08 | ₹113 Cr | 5 | −3.9%* | −3.9% |
| Purple Style LabsListed 07/09, after the book date | ₹100 Cr | 3 | n/a | −2.5%† |
Top 12 of 24 new names by position size. * listing close to 31 August. † move since listing, for companies that listed after the book date. “Since 31 Aug” runs to 17/09/2026. New positions count only names an existing fund initiated, so four funds that did not file a July portfolio are excluded.
Participation was graded, not uniform. The largest listing drew 33 funds; the smallest names in the table drew three or four. Funds did not take everything on offer.
Crowding did not predict outcome. Milky Mist, held by 14 funds, is the best performer of the group and is up 30.3% since month end. Shiprocket, held by 21, is the worst and has fallen 13.0%. Symbiotec drew 24 funds and is below its listing price. The three most widely held new names are not the three best.
Two names from last month’s table grew after listing rather than appearing fresh. Manipal Health Enterprises, bought before listing in July at ₹1,003 crore, is now ₹3,435 crore across 35 funds. Juniper Green Energy went from ₹154 crore to ₹714 crore. Exits remain a non-event: six names and ₹79 crore in total, the largest being Man InfraConstruction at ₹41 crore.
Pharma still leads. Small caps nearly caught it.
Last month pharma was the only theme beating small-cap funds over six months, by almost seven points. It still leads, but the gap is down to 1.4 points, because small-cap funds caught up rather than because pharma faltered.
| Theme | 1M | 3M | 6M▼ | 12M |
|---|---|---|---|---|
| Pharma & Healthcare | +3.1% | +13.4% | +21.7% | +21.6% |
| Manufacturing | +3.8% | +6.9% | +11.9% | +20.2% |
| Auto & Transport | +3.1% | +15.7% | +10.8% | +19.0% |
| Technology | +2.1% | +9.9% | +8.6% | −3.6% |
| Infrastructure | +0.4% | +0.4% | +7.0% | +10.0% |
| Consumption & FMCG | +0.2% | +7.5% | +6.1% | −0.3% |
| Banks & Financials | +1.5% | +7.5% | +0.7% | +11.5% |
| Energy & Power | −0.6% | −1.4% | +0.6% | +10.9% |
Median fund return per theme, ranked on 6M (marked ▼). 1M is context, never a ranking basis. The standing benchmark: small-cap funds’ 6M median is +20.3%. Only pharma clears it.
Technology is the theme to watch. Its six month number has gone from −7.8% last month to +8.6%, a swing of more than sixteen points without a spectacular August. That is the January to March collapse dropping out of the window rather than new strength. The twelve month number, still −3.6%, is the honest one.
Franklin India Technology holds 20.7% of the fund in Bharti Airtel, up from 20.5% last month. Taurus Banking & Financial Services holds 17.9% in ICICI Bank, ICICI Prudential FMCG holds 17.9% in Hindustan Unilever, and Aditya Birla Sun Life PSU Equity holds 17.8% in State Bank of India. A single stock stumble hits far harder here than in any diversified fund.
Every region rose. None kept up with Indian microcaps.
Every region made money in August. None of them kept up with Indian microcaps, and none of them made this month’s top ten non-diversified table.
| Region | 1M | 3M▼ | 6M | 12M |
|---|---|---|---|---|
| Global / Diversified | +3.2% | +1.9% | +11.4% | +24.9% |
| US / Nasdaq / AI | +2.4% | −1.9% | +15.5% | +28.8% |
| China / Hong Kong | +4.1% | −3.6% | +12.7% | +34.4% |
| Emerging / Brazil | +3.0% | −4.0% | +12.2% | +39.8% |
Median fund return per region, overseas fund-of-funds, gold and commodity funds excluded.
This section has run a contrast between domestic technology funds and global technology funds for two issues. It is retired this month. Domestic technology funds returned 2.1% in August and US and AI funds 2.4%. The two have converged, and a comparison that says nothing is not worth printing.
The twelve month column is the one to keep. Emerging markets at 39.8% and China at 34.4% remain the best returns available to an Indian investor over a year, and both beat every domestic theme in Section 07.
HSBC Small Cap: third percentile, then ninety-eighth.
The most extreme example of the two month whip. In July this fund sat in the third percentile of the whole diversified universe. In August it sat in the ninety-eighth. It holds ₹19,076 crore across 113 stocks, and its record shows why the swing happened.
| Episodeoldest first | Nifty 500 | Fund | Edge |
|---|---|---|---|
| Fall (Sep 24 → Feb 25) | −18.0% | −24.7% | −6.7 |
| Rally (Feb → Jun 25) | +18.8% | +25.6% | +6.8 |
| Fall (Jun → Aug 25) | −4.9% | −6.6% | −1.7 |
| Rally (Sep 25 → Jan 26) | +7.3% | +0.9% | −6.4 |
| Fall (Jan → Mar 26) | −14.8% | −13.5% | +1.3 |
| Rally (Mar → Jun 26) | +12.0% | +27.9% | +15.9 |
| July 2026 | +2.0% | −0.5% | −2.5 |
| August 2026 | −0.0% | +7.1% | +7.2 |
Windows measured month-end to month-end. The January 2026 point uses the 02/01 peak. Edge is the fund’s return minus the index’s, in percentage points.
This is a size bet, not a stock picking record. The fund amplifies whatever small caps do, in both directions. Its best stretch was the March to June rally, where it returned 27.9% against the index’s 12.0%, an edge of nearly sixteen points. Its worst was the September 2025 to January 2026 rally, where it made 0.9% over four months while the index made 7.3%, because that rally was led by large caps.
July and August are that record in miniature. It lost 2.5 points in the month large caps led, then gained 7.2 in the month they did not. The fund did not change. Its market did.
Motilal Oswal Multi Cap, featured last month, returned 7.6% in August, second only to Samco Small Cap across the diversified universe. It finished first in the multicap mandate for the second issue running.
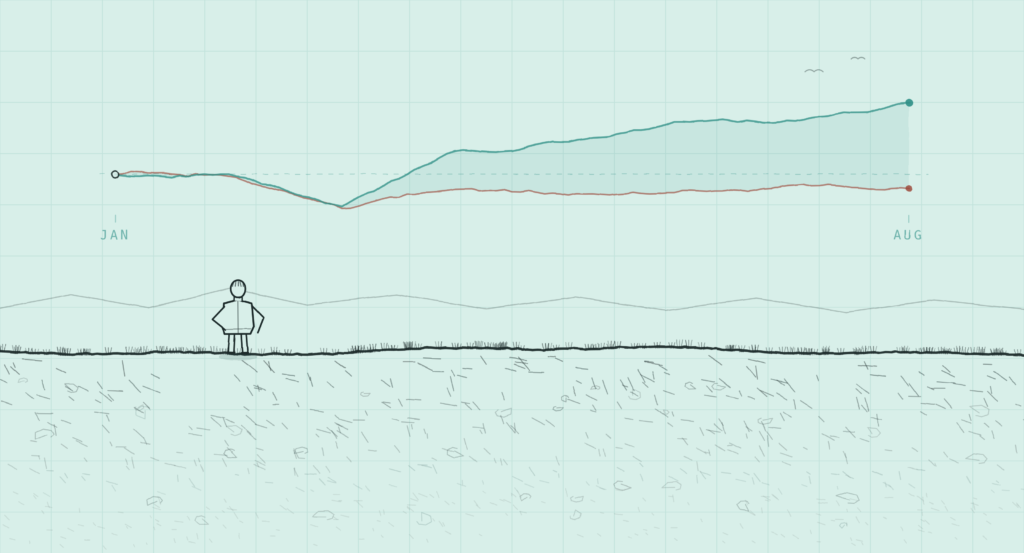
Two markets, one country
Both lines start at zero on 31/01/2026. The Microcap 250 ends the period 24.8% higher. The Nifty 50 ends it 4.9% lower. They fell together in March and have not travelled together since.
The gap is the story of 2026 so far. An investor in the largest companies has lost money this year. An investor in the smallest has made a quarter of their capital. The Nifty 500, which contains both, sits between them and tells you almost nothing on its own.
The chart also shows why one flat month can mislead. August moved the broad index by 0.04%. On these two lines, August is the steepest divergence of the year.
