


A Fall,
Then a Bounce
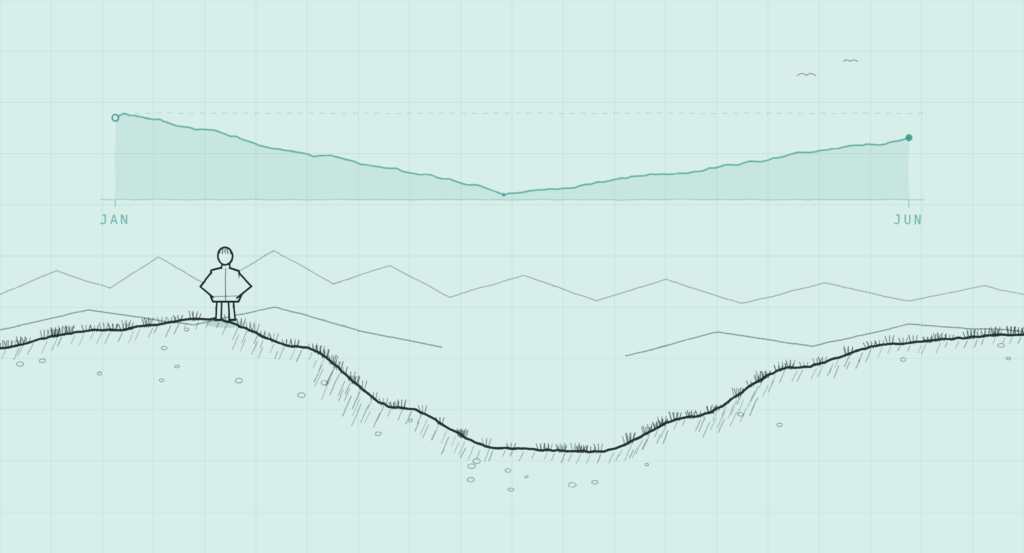
The market fell 14.8% from January to March, then rose 12.0% from April to June. It nearly got back to where it started. This issue looks at which funds handled the full fall and rise, not just the bounce.
A sharp bounce, led by smaller companies
The Nifty 500 rose 12.0% from April to June. This came after a fall of 13.3% from January to March. Over six months the index is about flat, down 2.8%. Over one year it is down 2.6%. The market won back most of its loss, but did not make a new high.
Smaller companies rose the most. The table shows the return of each part of the market over the quarter.
| Segment | Apr–Jun |
|---|---|
| Nifty 50 (large) | +6.9% |
| Nifty 100 | +8.9% |
| Nifty 500 | +12.0% |
| Midcap 150 | +17.2% |
| Smallcap 250 | +24.0% |
| Microcap 250 | +33.1% |
The pattern is simple. The smaller the company, the larger the gain. One part of the market did not join in. IT stocks fell 9.5% in the quarter and are down 32% over the year.
71% of 282 diversified funds beat the Nifty 500. But every small-cap fund beat it, and only 13% of large-cap funds did. Beating the index this quarter mostly meant owning smaller companies that had fallen further.
The rebound is only half the story
We look at 282 diversified equity funds. These are the direct plans, growth option, across nine categories: Flexi Cap, Large Cap, Large & Mid Cap, Mid Cap, Small Cap, Multi Cap, Contra, Value, and Focused.
On the rebound, funds that held smaller companies made more. The table below shows how much of the market’s 12.0% rally each type of fund captured. Above 100% means the fund rose more than the index.
| Category | Funds | Capture of the rally |
|---|---|---|
| Small Cap | 38 | 204% |
| Mid Cap | 37 | 144% |
| Multi Cap | 32 | 144% |
| Flexi Cap | 46 | 121% |
| Large & Mid Cap | 35 | 117% |
| Focused | 29 | 116% |
| Contra | 3 | 97% |
| Value | 22 | 95% |
| Large Cap | 40 | 78% |
| All diversified | 282 | 125% |
Small-cap funds captured twice the rally. Large-cap funds captured three-quarters of it. This is not skill. It is size. Small companies fell further, so they had more ground to win back.
The full story is the round trip: the fall and the rise together. Over the round trip, the funds that fell hard and then bounced hard ended up ahead of the funds that fell less but did not bounce. The table sorts every fund into four groups by how it did on the way down and on the way up.
| Group | Funds | Avg 6M return |
|---|---|---|
| Caught the rally, lost less in the fall | 159 | +5.6% |
| Lost less, but missed the rally | 62 | −3.2% |
| Caught the rally, but fell hard | 36 | +0.9% |
| Missed the rally, and fell hard | 15 | −5.7% |
Read the last two rows together. Funds that lost less but missed the rally were down 3.2%. Funds that fell hard but caught the rally were up 0.9%. So catching the rally mattered more than cushioning the fall. The full picture is in The Chart.
Did holding cash help? Only when the timing was right.
The simple way to limit a fall is to hold cash. On its own, this did not help. Funds that held more than 10% cash at the December peak gained just 0.3% over six months. Funds that were nearly fully invested gained 2.5%. Holding cash did not protect them, and holding a lot of it hurt.
| Cash held at the Dec peak | Funds | 6M return |
|---|---|---|
| Under 3% | 149 | +2.5% |
| 3 to 6% | 77 | +2.3% |
| 6 to 10% | 31 | +2.4% |
| Over 10% | 13 | +0.3% |
Timing was a different thing from level. A few funds did it well. They were fully invested at the top. They raised cash as the market fell. They put that cash back to work at the bottom. Seventeen funds did this. Their median return over six months was 6.9%, against 1.0% for the rest, and 12 of the 17 ended up positive. Very few managed it, and doing it badly was worse than not trying at all.
Bank of India Flexi held almost no cash in December. It raised cash to 20% by February as the market fell. It spent that cash near the bottom in March, then rode the recovery. Samco did the opposite: it went to about 80% cash at the March bottom, the worst possible moment, and missed the rally. SBI Contra held about 11% cash the whole time and never spent it. Same tool, three very different results.
Which funds moved up, and which moved down
We rank each fund against others in its category, twice. Once for the fall, using returns to the end of March. Once for the rally, using returns to the end of June.
A percentile rank of 100 is the best in the category. A percentile rank of 0 is the worst.
Some funds were near the bottom in the fall and near the top in the rally. They fell more than their peers, then rose more.
| Moved up | Category | Fall percentile rank | Rally percentile rank |
|---|---|---|---|
| Motilal Oswal Multi Cap | Multi Cap | 0 | 100 |
| JM Small Cap | Small Cap | 3 | 100 |
| Quant Focused | Focused | 4 | 100 |
| Invesco India Flexi Cap | Flexi Cap | 2 | 98 |
| Invesco India Midcap | Mid Cap | 9 | 94 |
Other funds did the reverse. They were near the top in the fall and near the bottom in the rally. These are the defensive funds. Several are the same cash-heavy funds from the cash section.
| Moved down | Category | Fall percentile rank | Rally percentile rank |
|---|---|---|---|
| Samco Large & Mid Cap | Large & Mid | 100 | 0 |
| Capitalmind Flexi Cap | Flexi Cap | 100 | 2 |
| Samco Large Cap | Large Cap | 100 | 3 |
| Parag Parikh Flexi Cap | Flexi Cap | 93 | 0 |
| Mahindra Manulife Focused | Focused | 93 | 4 |
The two tables are mirror images. The funds that led the fall led it because they held back, in cash or in large, steady stocks. That same caution left them behind in the rally.
The best funds of the quarter
The top five funds in each of four fund groups, ranked by return from April to June, direct growth. The two columns after show the quarter before, January to March, and the past year. Every fund here fell in the first quarter and rose in the second. The size of the swing tracks the size of the companies: small-cap funds swung most, large-cap funds least.
| Multicap mandate | Apr–Jun | Jan–Mar | 1 year |
|---|---|---|---|
| Quant Large & Mid Cap | +25.5% | −12.7% | +5.7% |
| Invesco India Large & Mid Cap | +25.2% | −12.9% | +7.2% |
| Quant Flexi Cap | +24.1% | −10.8% | +10.4% |
| Motilal Oswal Multi Cap | +23.0% | −17.7% | −2.2% |
| Quant Multi Cap | +22.7% | −11.2% | +3.3% |
| Large Cap | Apr–Jun | Jan–Mar | 1 year |
|---|---|---|---|
| Quant Large Cap | +20.3% | −13.7% | +3.4% |
| Invesco India Largecap | +15.9% | −12.9% | +1.0% |
| Bank of India Large Cap | +13.0% | −10.6% | +4.0% |
| ITI Large Cap | +12.5% | −14.3% | −3.5% |
| SBI Large Cap | +11.9% | −12.2% | +0.2% |
| Mid Cap | Apr–Jun | Jan–Mar | 1 year |
|---|---|---|---|
| HSBC Midcap | +27.0% | −8.6% | +17.7% |
| Invesco India Midcap | +25.1% | −13.7% | +8.9% |
| Helios Mid Cap | +25.0% | −13.5% | +14.9% |
| JM Midcap | +24.6% | −10.7% | +8.9% |
| LIC MF Midcap | +20.7% | −12.8% | +2.1% |
| Small Cap | Apr–Jun | Jan–Mar | 1 year |
|---|---|---|---|
| JM Small Cap | +37.0% | −13.7% | +10.4% |
| Bank of India Small Cap | +34.7% | −8.4% | +16.4% |
| Motilal Oswal Small Cap | +31.8% | −11.5% | +14.2% |
| TRUSTMF Small Cap | +31.7% | −8.3% | +24.8% |
| Helios Small Cap | +31.4% | −13.3% | n/a |
The next table is the funds we do not count as diversified: sector, thematic, and overseas funds. Here the winners are global. US and AI technology funds led. One Taiwan fund is up 177% over the year.
| Sector / thematic / global fund | Apr–Jun | Jan–Mar | 1 year |
|---|---|---|---|
| Mirae Global X AI & Technology FoF | +46.2% | −8.3% | +65.6% |
| Edelweiss US Technology FoF | +41.9% | −11.4% | +42.8% |
| Motilal Oswal Nasdaq 100 FoF | +40.7% | +0.1% | +68.5% |
| Nippon India Taiwan Equity | +38.8% | +43.2% | +177.3% |
| Quant Manufacturing | +36.7% | −14.1% | +12.8% |
| HDFC Defence | +35.7% | −5.2% | +16.0% |
| Quant ESG Integration | +34.4% | −13.2% | +15.3% |
| PGIM India Global Equity Opp FoF | +33.1% | −11.2% | +26.0% |
| Motilal Oswal Innovation Opportunities | +33.0% | −12.8% | +14.3% |
| Invesco Global Consumer Trends FoF | +32.0% | −10.9% | +31.9% |
Direct growth plans. A blank one-year figure means the fund is less than a year old. These are the funds that returned the most; this is a record of what happened, not a list of what to buy.
What the funds own
The ten largest holdings in each type of fund at the end of June. Each figure is the combined money across all funds in the group, shown as a share of the group’s equity. Banks sit near the top of almost every list. Small-cap funds are the exception: their biggest single holding is just 1.3%, so they spread their money across many names.
Large Cap
| ICICI Bank | 9.0% |
| HDFC Bank | 8.8% |
| Reliance | 5.2% |
| Larsen & Toubro | 4.3% |
| Axis Bank | 4.0% |
| Bharti Airtel | 3.8% |
| Infosys | 3.1% |
| Kotak Bank | 2.7% |
| SBI | 2.6% |
| M&M | 2.2% |
Multi, Flexi & Large-and-Mid
| HDFC Bank | 5.6% |
| ICICI Bank | 5.3% |
| Axis Bank | 3.0% |
| SBI | 2.1% |
| Bharti Airtel | 2.0% |
| Eternal | 1.9% |
| Larsen & Toubro | 1.7% |
| Kotak Bank | 1.7% |
| Reliance | 1.6% |
| Maruti | 1.6% |
Mid Cap
| Federal Bank | 3.1% |
| Fortis | 2.0% |
| Max Financial | 1.9% |
| AU Small Fin Bank | 1.8% |
| Ipca Labs | 1.6% |
| Bharat Forge | 1.5% |
| BSE | 1.5% |
| Eternal | 1.4% |
| Indian Bank | 1.4% |
| Coforge | 1.4% |
Small Cap
| KIMS | 1.3% |
| Aster DM | 1.3% |
| RBL Bank | 1.0% |
| Apar Industries | 1.0% |
| City Union Bank | 1.0% |
| Karur Vysya Bank | 0.9% |
| Navin Fluorine | 0.9% |
| MCX | 0.8% |
| Kirloskar Oil | 0.8% |
| Kalpataru Projects | 0.8% |
Contra
| ICICI Bank | 5.5% |
| Reliance | 4.7% |
| HDFC Bank | 4.2% |
| Biocon | 2.6% |
| Larsen & Toubro | 2.5% |
| Axis Bank | 2.4% |
| Kotak Bank | 2.4% |
| SBI | 2.3% |
| Indus Towers | 2.1% |
| Torrent Power | 1.9% |
Value
| HDFC Bank | 7.8% |
| ICICI Bank | 7.4% |
| Reliance | 4.1% |
| Infosys | 3.5% |
| Axis Bank | 3.0% |
| ITC | 2.7% |
| Sun Pharma | 2.6% |
| Maruti | 2.4% |
| SBI | 2.4% |
| Bharti Airtel | 2.3% |
The book also rotated. The table shows how sector weights changed from January, near the market top, to June. Managers cut IT hard and trimmed banks. They added to industrials, retail, healthcare, and pharma.
| Sector | Jan | Jun | Shift |
|---|---|---|---|
| Electrical Equipment | 2.2% | 3.2% | +1.0 |
| Retailing | 4.2% | 4.8% | +0.6 |
| Healthcare Services | 2.3% | 2.8% | +0.6 |
| Pharma & Biotech | 5.6% | 6.1% | +0.5 |
| Capital Markets | 2.6% | 3.0% | +0.4 |
| Insurance | 2.4% | 2.2% | −0.3 |
| Petroleum Products | 2.9% | 2.4% | −0.5 |
| Banks | 19.2% | 18.3% | −0.9 |
| IT – Software | 6.2% | 4.0% | −2.2 |
Diversified direct-growth funds. Holdings breakdown covers the six cap and style groups above; Focused funds are counted in the return figures elsewhere but not split out here.
The stocks funds bought for the first time
These are stocks that no diversified fund held at the end of May, but at least one fund held at the end of June. They are fresh buys. In June, funds added 18 new names worth ₹536 Cr in all. That is a tiny slice of the more than ₹27 lakh crore these funds hold in equity, so these are small, early positions. What they show is where managers are starting to look. The two return columns are the stock’s own price, first over June, then from the end of June to 21 July.
| New stock | Position | Funds | May–Jun | Jun–21 Jul |
|---|---|---|---|---|
| Paras Defence & SpaceDefence & space | ₹198 Cr | 7 | +57.3% | −5.2% |
| Turtlemint FintechFintech · IPO 29 Jun | ₹75 Cr | 4 | +0.9%* | −0.7% |
| CMR Green TechnologiesAluminium recycling · IPO 10 Jun | ₹64 Cr | 3 | +3.9%* | −11.6% |
| Jash EngineeringIndustrial equipment | ₹39 Cr | 3 | +25.9% | +2.3% |
| Borosil RenewablesSolar glass | ₹27 Cr | 3 | +20.0% | −1.0% |
| Anlon TechnologyEngineering · NSE SME | ₹24 Cr | 1 | −2.1% | −0.2% |
| Hexagon NutritionNutrition · IPO 12 Jun | ₹19 Cr | 1 | +25.2%* | +9.5% |
| Advit JewelsJewellery · pre-listing, listed 1 Jul | ₹16 Cr | 4 | n/a | +13.2%† |
| Waterways Leisure TourismTourism · pre-listing, listed 1 Jul | ₹15 Cr | 1 | n/a | +35.7%† |
| SML MahindraTrucks & LCVs | ₹14 Cr | 2 | +9.4% | −0.4% |
| Indo Tech TransformersTransformers | ₹13 Cr | 1 | +28.6% | +5.7% |
| Horizon ReclaimRubber recycling · BSE SME, listed 19 Jun | ₹12 Cr | 1 | n/a | +8.8% |
Position is the combined money across all diversified funds. * A June listing, so there is no May price; the May–Jun figure is the gain from its listing price to 30 June. † Advit Jewels and Waterways listed on 1 July, so have no June-end price; their figure is the move from the listing price to 21 July. Horizon Reclaim is a BSE SME stock; its June-to-July figure uses BSE prices.
Two things stand out. First, funds bought into strength and much of it has since cooled. Paras Defence, the largest new buy, entered seven funds after already rising 57% in June, then gave back 5% by 21 July; CMR Green is down 12% since June-end. Hexagon Nutrition is the exception, still climbing, up another 9.5%. Second, half of these names are fresh IPOs, and funds even took pre-listing allotments in Advit Jewels and Waterways, both up double digits since they listed on 1 July.
Pharma led; technology was the worst place to be
Themes rose and fell far apart this quarter. Pharma was the one theme that beat small-cap funds over six months, up 15.0% against their 11.7%, and it beat them over the year too. Technology was the opposite, down 21% over six months.
| Theme | 3M | 6M | 12M |
|---|---|---|---|
| Pharma & Healthcare | +18.4% | +15.0% | +14.3% |
| Infrastructure | +19.4% | +10.8% | +5.4% |
| Manufacturing | +16.3% | +7.9% | +11.5% |
| Energy & Power | +11.7% | +6.5% | +5.8% |
| Auto & Transport | +16.1% | −0.5% | +13.3% |
| Banks & Financials | +16.2% | +0.3% | +2.6% |
| Consumption & FMCG | +13.3% | −4.2% | −3.4% |
| Technology | +2.5% | −21.2% | −18.8% |
Some sector funds hold close to a fifth of the portfolio in one stock. Franklin India Technology holds 20.5% in Bharti Airtel. ICICI Prudential FMCG holds 18.5% in HUL and 18.3% in ITC, over a third of the fund in two names. If one stock falls, the fund feels it far more than a diversified fund would.
The best returns were abroad
Overseas funds were the strongest part of the market. The table shows the median return of overseas funds by region. US, AI, and emerging-market funds led. Even the weakest region, China, was positive.
| Region | Funds | 3M | 6M | 12M |
|---|---|---|---|---|
| US / Nasdaq / AI | 8 | +30.7% | +24.7% | +46.9% |
| Emerging / Brazil | 6 | +24.3% | +32.4% | +54.6% |
| Global / Diversified | 39 | +12.6% | +13.7% | +27.4% |
| China / Hong Kong | 3 | +8.8% | +13.8% | +42.8% |
This is the sharpest contrast in the whole market. Indian IT funds fell about 21% over six months. US technology funds rose 25% or more over the same period. The trouble in technology was an Indian-IT story, not a global one.
Union Small Cap: it wins by losing less
One fund is worth a closer look. Union Small Cap fell the least of any small-cap fund in the January to March fall, then caught the rally in full. That is why it went from 16th in its category on the three-month bounce to 4th over the round trip. Across the last ten market swings, it beat its index in seven.
| Market swing | Index | Fund | Edge |
|---|---|---|---|
| Rally (Mar–Jun 26) | +13.5% | +25.2% | +11.7 |
| Fall (Jan–Mar 26) | −14.8% | −8.2% | +6.6 |
| Fall (Jun–Aug 25) | −5.0% | −2.2% | +2.7 |
| Rally (Feb–Jun 25) | +18.8% | +24.1% | +5.3 |
| Fall (Sep 24–Feb 25) | −18.8% | −23.1% | −4.3 |
It has one weak spot. In the long, slow fall of late 2024 it dropped more than the index. Like most small-cap funds, it handles sharp falls well and slow ones poorly. The pattern is simple: lose less in the fall, then take part in the recovery.
272 funds, two questions: did it catch the rally, did it cushion the fall
Every diversified fund is placed by how much of the rally it caught, across the bottom, and how much of the fall it took, up the side. Higher up means it fell less. The best place to be is the top right: caught the rally and lost less.
The funds are spread wide left to right and packed tight top to bottom. That means they differed a lot in how much of the rally they caught, but hardly at all in how much of the fall they took. Nearly everyone lost about 90% of the fall. Small-cap funds sit to the right. Large-cap funds sit to the left. The rally, not the fall, is what set the year apart.
How to read this issue
Diversified means direct-growth equity funds across nine categories: Flexi, Large, Large & Mid, Mid, Small, Multi, Contra, Value, and Focused. Upside capture is a fund’s rally return as a share of the Nifty 500’s +12.0%. Drawdown capture is its fall as a share of the index’s −14.8%. Ranks and percentiles are within category. All figures as on 30/06/2026 unless stated. This is a record of what happened; nothing here is a recommendation.
